How financial markets work
A market is a process that matches buyers and sellers. Prices change as orders interact with available liquidity and as participants update beliefs about value and risk. This guide explains the mechanics in practical terms so you can interpret charts and execution realistically.
- Key idea
- Price discovery
- Key driver
- Liquidity
- Key risk
- Execution
This page explains concepts such as bids, asks, spreads, order types, liquidity, and volatility. It is educational only and does not recommend any trade or product.
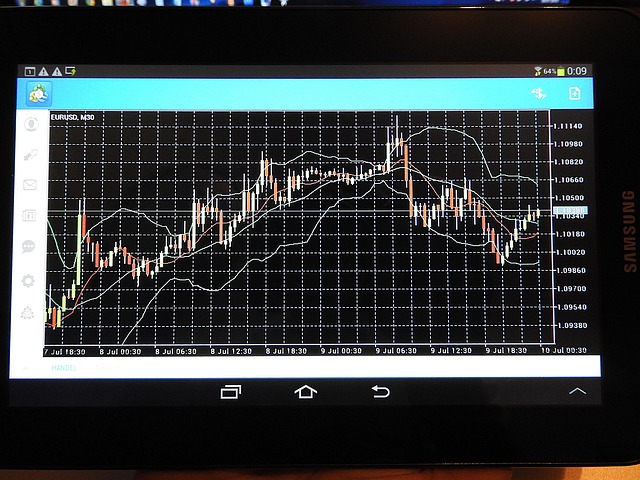
1) Price discovery
Price discovery is the ongoing process of finding the level where buyers and sellers agree to transact. Every trade prints at a price, and the collection of those trades becomes the chart you see. Importantly, price is not a statement of certainty. It reflects the current balance of willingness to buy versus willingness to sell, under existing constraints such as information, time, and risk limits.
Why prices change
Prices move when demand and supply shift, when new information changes expectations, or when liquidity becomes scarce in a given price zone.
Fair value is not fixed
Different participants value the same asset differently based on time horizon, constraints, and risk preferences, so the traded price can shift quickly.
2) Bids, asks, and spreads
In most markets you will see two prices. The bid is the best available price to sell immediately. The ask is the best available price to buy immediately. The difference between them is the spread. When you place a market order, you usually transact on the opposite side of the spread.
How to interpret the spread
Tight spread
Often indicates deeper liquidity and more competition between buyers and sellers. Execution tends to be smoother.
Wide spread
May indicate low liquidity, higher uncertainty, or fast movement. It can increase transaction costs and slippage.
Practical point: A trading plan should consider spreads and volatility because they affect how far price must move before a trade becomes profitable after costs.
Market orders
A market order prioritizes speed. It fills at the best available prices, which can vary during fast moves.
Limit orders
A limit order prioritizes price. It may not fill if the market does not trade at your limit price.
3) Liquidity and order flow
Liquidity describes how easily an asset can be bought or sold without materially moving its price. High liquidity typically means many orders near the current price. Low liquidity means fewer orders, so even modest size can move the market. Order flow is the stream of buying and selling that consumes liquidity and pushes price to new levels.
Depth and slippage
If there is not enough size at the best bid or ask, orders can fill across multiple price levels. This effect is called slippage.
Order book basics
The order book displays resting buy and sell interest. The visible book can be incomplete, but it helps explain why price may pause at certain levels.
Who provides liquidity?
Liquidity can come from many sources: investors placing limit orders, market makers quoting two-way prices, and algorithmic participants adjusting orders rapidly. Their activity is influenced by risk limits, inventory, and news risk, which is why liquidity can disappear during shocks.
When liquidity thins, spreads can widen and execution becomes less predictable. For learners, this is a reminder that a chart is only part of the story. The ability to enter and exit at expected prices matters just as much.
4) Volatility, sessions, and catalysts
Volatility is the magnitude of price change over time. It can rise around events such as economic releases, earnings, or central bank decisions. Trading hours and session overlaps can also affect activity levels, which can influence spreads and speed of movement.
Catalysts
A catalyst is new information that changes expectations. It can cause repricing when many participants update positions at once.
Regimes
Markets shift between regimes such as trending and ranging. A method that works in one regime can struggle in another.
Execution reminder
During high volatility, stop losses and market orders can fill at worse prices than expected. A learning plan should include how volatility can change the practical outcome of the same chart setup.
Putting it together responsibly
Understanding market mechanics helps you evaluate trade ideas more realistically. Instead of asking only, “Will price go up or down?”, you can also ask: What is liquidity like? How wide is the spread? What is the volatility regime? What is the plan if execution is imperfect? These questions improve decision quality even when outcomes are uncertain.
A simple learning flow
-
Step 1: Define terms
Make sure you can explain bid/ask, spread, liquidity, volatility, and order types without guessing.
-
Step 2: Add context
Identify session timing, upcoming catalysts, and whether the market is trending or ranging.
-
Step 3: Plan risk
Predefine maximum loss and how you will manage slippage. Risk rules are part of the strategy.
-
Step 4: Review outcomes
Track decisions and execution. Separate a good process from a lucky outcome.
Disclaimer
Trading involves significant risk of capital loss. Past performance does not guarantee future results. This website is for educational purposes only and is not financial advice.